For the purposes of this exercise, let’s look at a sample pet food subscription box company called Puppy Bits. While this example uses a subscription box business model, this approach is appropriate for any recurring billing service, from streaming to SaaS providers.
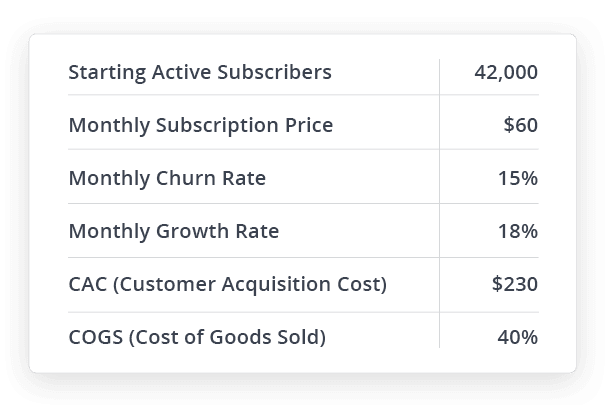
Here are Puppy Bits’ operating statistics for the first month that we start looking at their P&L.
To provide clarity on sources of revenue, the pro forma income statement has broken out the revenue components for each month, including starting revenue, revenue lost to churn, and revenue gained from new customer acquisition.
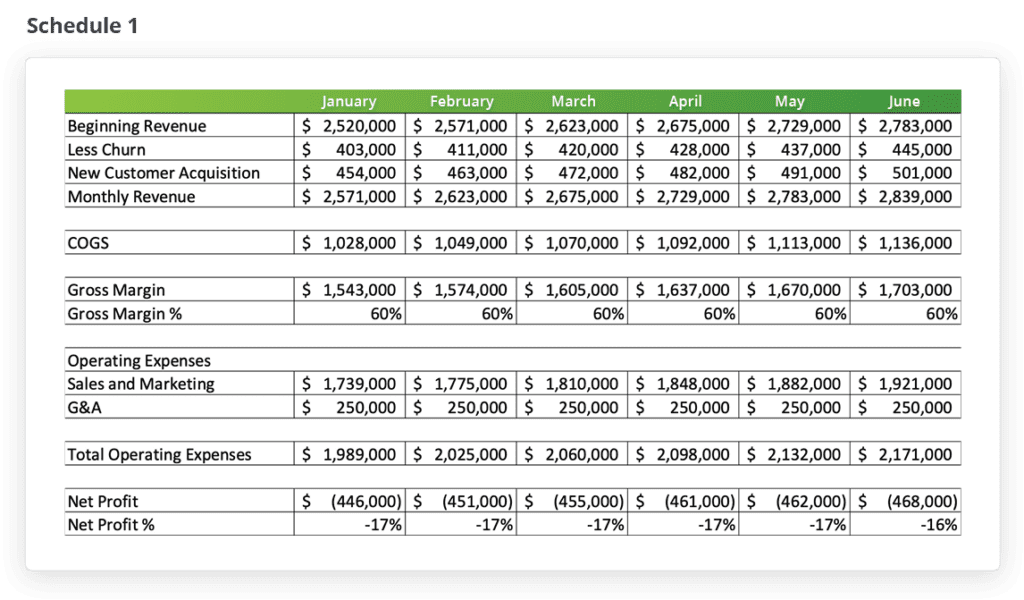
As you can see, this business is acquiring more customers than they are losing to churn, but they are continuing to operate at a monthly loss due to their overhead expenses and customer acquisition costs.
Puppy Bits is churning customers at a rate of 16% per month. The company has recognized that 50% of their monthly churn is being caused by unrecovered failed payments, rather than by customers choosing to end their subscriptions. Failed payments is the term for credit card authorization declines when subscription merchants submit their customer’s card for payment. When a subscriber’s credit card is declined by the issuing bank, the customer churns if their payment isn’t recovered.
The solution that Puppy Bits has implemented starts recovering 25% of their failed payments and saving these customers from involuntary churn. These recovered customers will continue to be active for an average of four billing cycles following recovery.
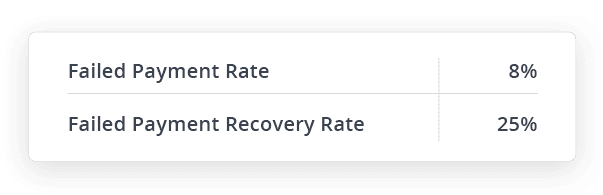
Now let’s analyze the changes on the P&L that occur when churn is reduced by recovering 25% of failed payments. Since failed payments account for 50% of Puppy Bits total churn, this recovery rate reduces the company’s monthly churn rate from 16% to 14%. While this looks like a relatively small reduction in churn, the impact on revenue and profitability is quite large.
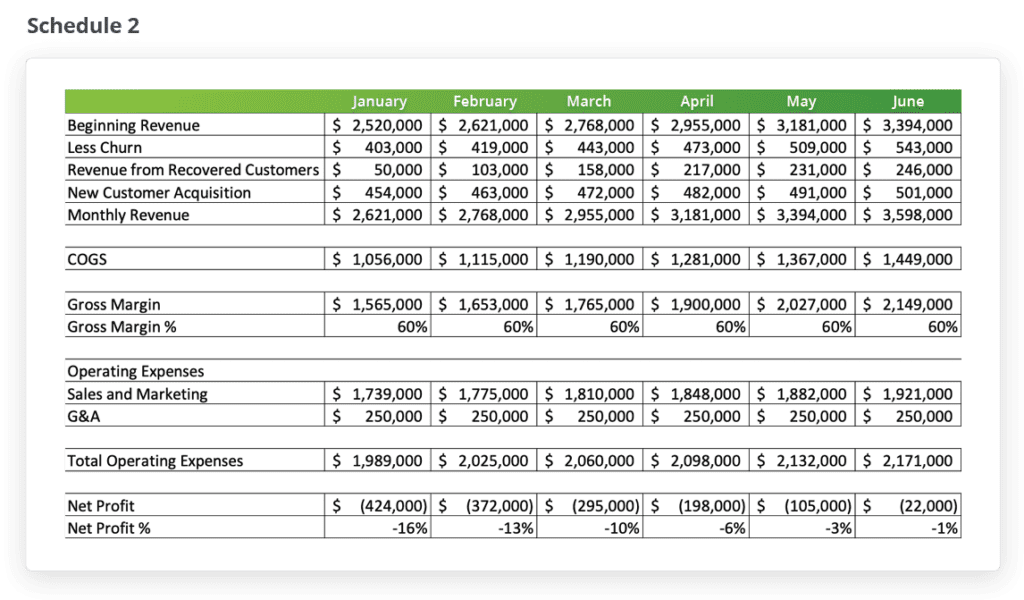
For illustrative purposes, the number of recovered customers who will continue to bill for an additional four months following recovery is broken out on a new line called Revenue from Recovered Customers. This would normally be hidden in the top line revenue line.
Is it accurate to assume there will be four additional months of billing from recovered customers? While every subscription company’s results will vary based upon their customers and their product or service, we have found that this is a reasonable number to use as an average. We see some companies whose average billing period following recovery is more than 10 months, while some see an average closer to just two payments, so it is critical to measure this value.
You can see the revenue from recovered customers grow quickly until it slows in May. This leveling off occurs when the customers recovered in January reach the end of their 4 month lifespan following recovery, stopping the compounded growth created by each new month of billing from recovered customers.
Let’s look at the key changes in Puppy Bits’ results in June with their reduction in churn compared to their run rate forecast in Schedule 1 where a failed payment recovery solution isn’t in place.
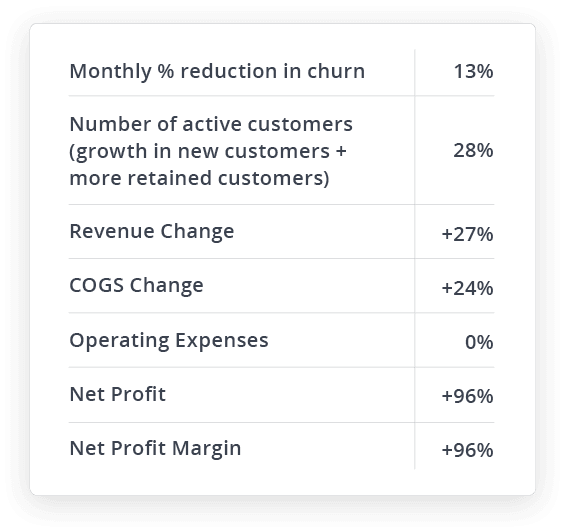
This example vividly demonstrates what we mean when we say that increasing customer retention creates positive financial leverage: a given percentage increase in customer retention creates a higher percentage of gains in revenue and profitability. Increasing customer retention creates profit leverage because the revenue gains are earned without any increase in customer acquisition costs or any increase in fixed costs. While a company may choose to use these increased profits and cashflow to fund new initiatives that increase general and administrative expenses or choose to increase customer acquisition budgets (which leads to higher spend levels in these categories), these are new spending choices that are made possible by increased profits rather than expense increases directly caused by higher rates of retention.
Notably, without a failed payment recovery solution that improves customer retention, Puppy Bits delivers a 15% net operating loss in June. But with a failed payment recovery solution that increases retention by just 13%, the company almost reaches break even in June. In fact, if you run out the forecast for 12 months, the 13% increase in retention allows Puppy Bits to earn an 8% net profit margin, compared to a 14% loss without the gain in retention.
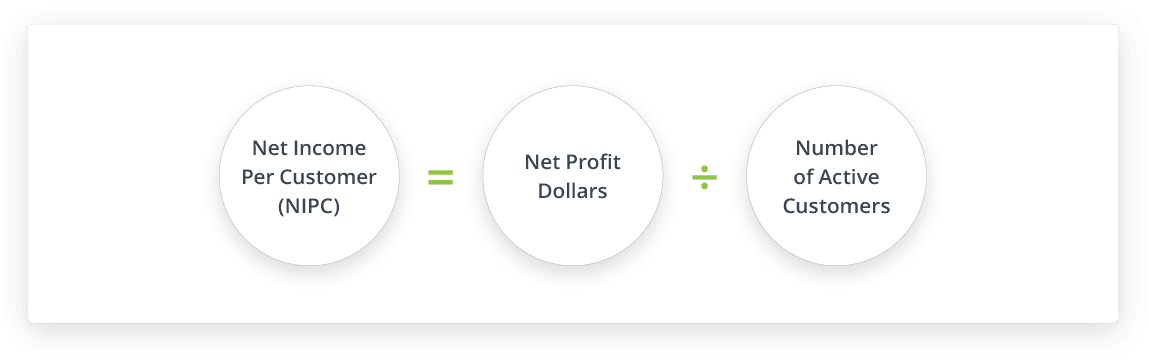
We propose a solution to this problem with a new metric called Net Income Per Customer (NIPC). The formula to calculate NIPC is: Net Profit Dollars / Number of Active Customers.
NIPC addresses several unmet needs:
- It provides a measure of how much each active subscription customer contributes to profits.
- It measures the profit contributions created by increased customer retention when fixed costs don’t materially change.
- Companies competing against each other in a given industry typically face similar pricing and customer acquisition cost levels, so NIPC should be affected in similar ways when comparing similar companies. NIPC is a way to benchmark companies that earn higher retention rates, and to measure its impact on profit delivery.
While changes in variable expenses, such as COGS and customer acquisition costs impact net profits, there may also be other factors that impact net profits and the NIPC value. But if you remove these from evaluation, NIPC will track the impact of customer retention changes on net profits.
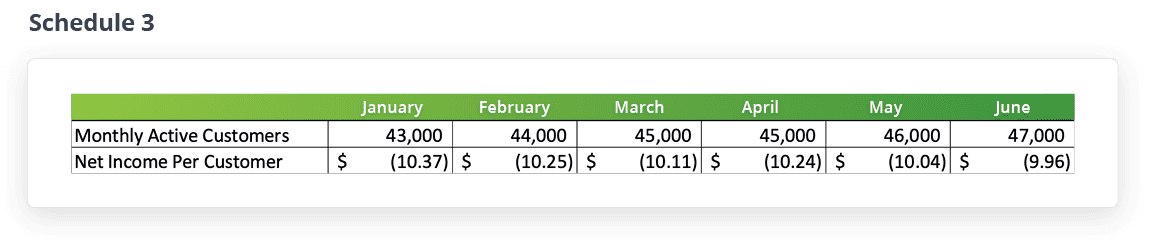
Let’s look at our example company again and see how NIPC identifies the source of their ability to generate more revenue from customers without having to burn more resources on acquisition. Schedule 3 is a calculation of Puppy Bits’ monthly NIPC without any change in customer retention.
Schedule 4 measures Puppy Bits’ monthly NIPC with the 13% improvement in customer retention.
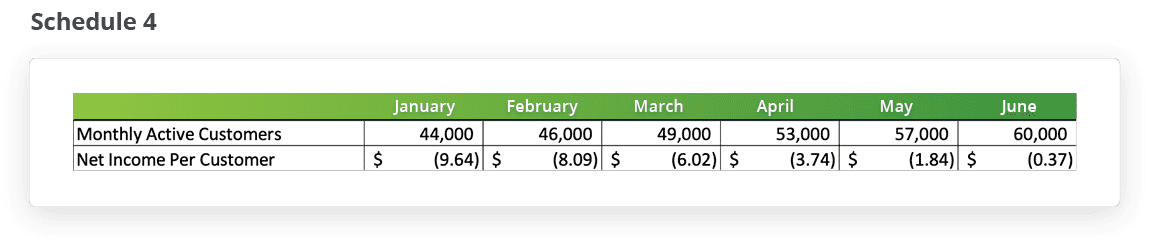
In this comparison, the improvement in retention starts in month one, but as the number of customers actively billing continues to grow, the separation in net income per customer continues to grow as well. As we identified previously, this improvement in net income is created because the profitability of retained customers is so much higher than the revenue generated when acquiring new customers (i.e. operating expenses do not increase when revenue improves through increased customer retention).
The gains from customer retention create financial leverage in the form of a 28% increase in monthly active customers and a 96% gain in NIPC. The NIPC equation identifies how the company accomplished the gain in net profits in 12 months that we measured earlier.